Species richness, or the number of species in an area of interest, is commonly used as a simple measure of biodiversity. The number of species recorded in a block is of course influenced by the amount of effort spent on atlasing the block (Fig. 6). But at a coarse scale, we can evaluate other factors that contribute to species richness.
We used multiple regression to assess the effects of land cover diversity, road density, wetlands, elevation, latitude, the number of hours spent atlasing, and all combinations of these variables, on species richness in blocks from the second Atlas. This analysis evaluates the relationship of each variable to species richness while controlling for the effects of the other variables.
Figure 6. Relationship between the number of species found (species richness) and number of hours surveyed (effort) in Vermont Atlas blocks. The red line is the linear regression estimate and blue dashed lines are upper and lower 95% confidence intervals around the estimate.
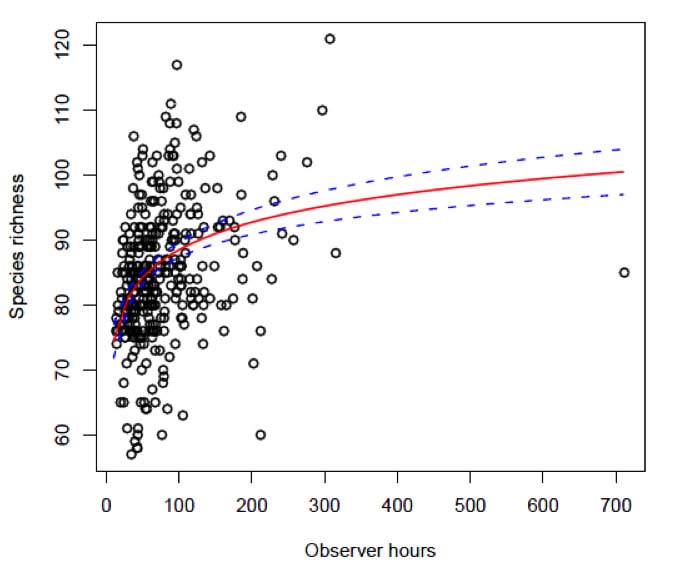
Blocks with the most observer hours totaled nearly 25 more species on average than blocks with the fewest observer hours, all other factors being equal. The most homogenous blocks supported on average almost 14 fewer species than blocks with the most diverse land cover.
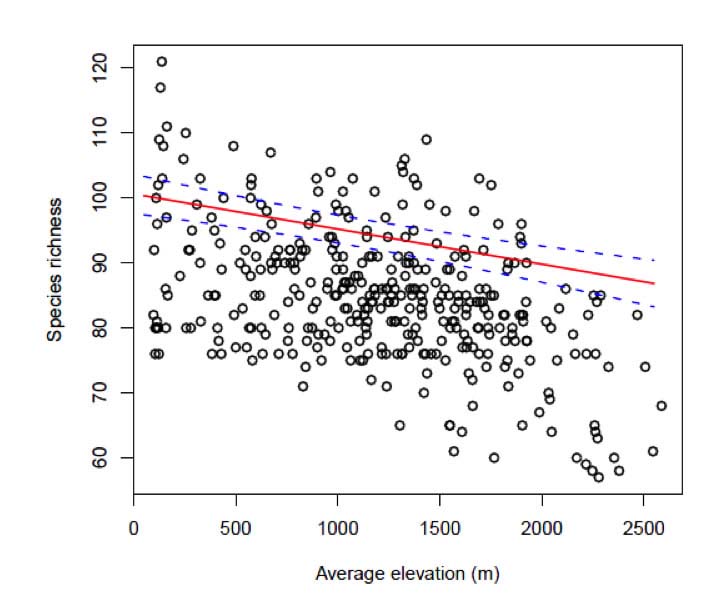
In general, species richness is influenced by elevation. Different elevations provide a wider variety of ecological niches, allowing more species to occupy the area, however, higher elevation lands often support fewer bird species than lands at lower elevations. Results from the regression analysis showed that blocks with a higher average elevation had fewer species, even though they also had a wider range of elevation (Fig. 7). Taking into account other factors that affect species richness, including land cover diversity, the highest elevation blocks supported about 13 fewer species than the lowest elevation blocks.
Figure 7. Relationship between the number of species found (species richness) and average elevation in Vermont Atlas blocks. The red line is the linear regression estimate using a standardized high amount of effort (to more closely reflect the true species richness in blocks), and blue dashed lines are upper and lower 95% confidence intervals around the estimate.
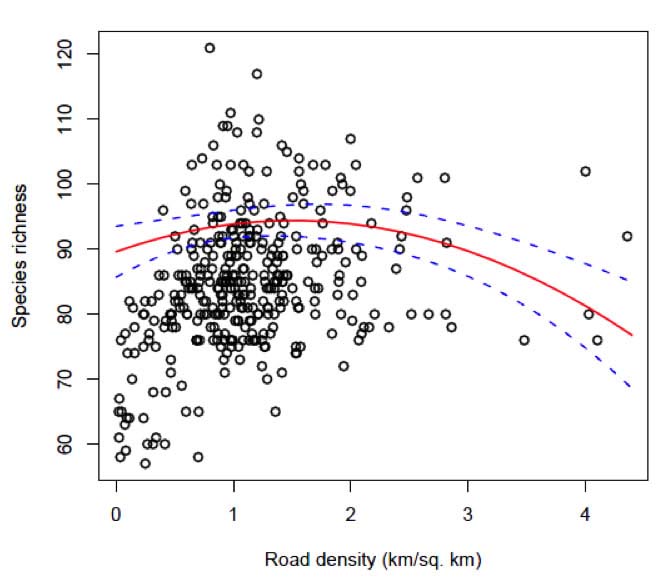
Species richness increased with road density except at the highest road densities, where species richness was low (Fig. 8). Blocks with the highest road densities are dominated by urban and suburban development that would predictably harbor fewer bird species. Alternatively, blocks with very low road densities were likely the most remote blocks with more homogenous land cover; this is supported by the fact that road density was positively correlated with land cover diversity.
Figure 8. Relationship between the number of species found (species richness) and road density in Vermont Atlas blocks. The red line is the linear regression estimate using a standardized high amount of effort (to more closely reflect the true species richness in blocks), and blue dashed lines are upper and lower 95% confidence intervals around the estimate.
It is important to note that while land cover diversity, average elevation, latitude, and road density were important predictors of species richness, they collectively explained only up to 40 percent of the variability in the number of species across the state. This means that there are other influences on the number of species in a block, probably including the types and relative proportions of habitat.