The number of hours spent on blocks provides some information about the amount of coverage a block received as a potential proxy for effort. During the second Atlas, 50% of blocks received at least 60 hours of coverage, and over 75% of blocks received at lest 40 hours of coverage (Fig. 1).
Figure 1. Atlasing hours reported from Priority 1 and 2 blocks during the second Vermont Breeding Bird Atlas (2003-2007).
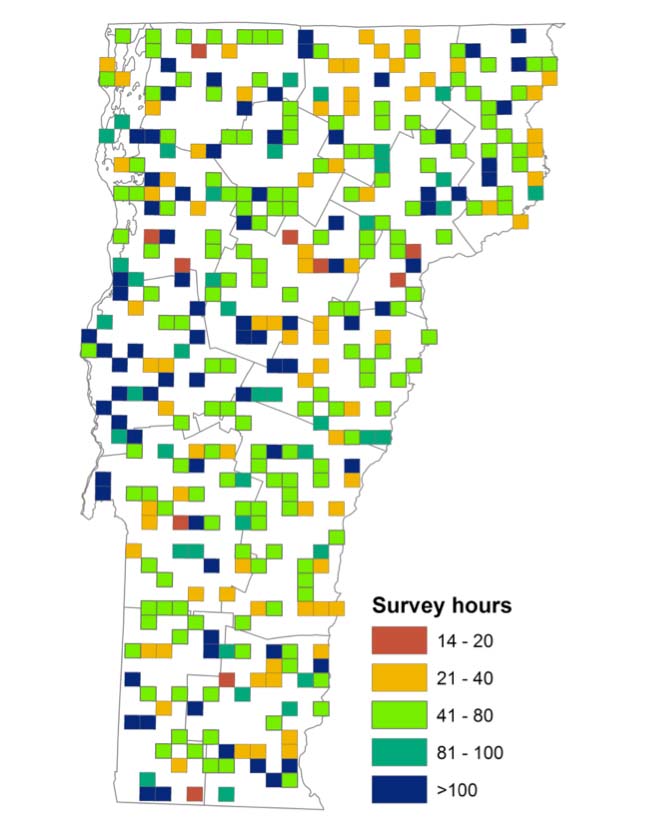
Atlas 2 Survey Hours
Though the exact number of participants is unknown, the Atlas employed the help of between 300-350 citizen scientists for block coverage. Hours in the field varied considerably among atlasers. The “top ten” atlasers logged from 457 to 1,487 hours each. For the remainder of the atlasers that entered any hours into the database, an average of 110 hours per person were spent in the field.
Types of atlasing such as daytime versus nighttime, and point counts versus incidental observations, were tallied separately (Table 1). Although blockbusting hours are likely underestimated, we do know that some extent of blockbusting was carried out on at least 100 blocks, ranging from <1 to 105 hours per block.
Table 1. Minimum total hours recorded atlasing per block and by type of atlasing effort. Priority 1 blocks received 22.2 hours more coverage per block, for a total of 3505 more hours of surveys than Priority 2 blocks.
| Hours Surveyed | Priority 1 | Priority 2 | Non-priority | TOTAL |
| Total |
15672.2 |
12167.4 |
2602 |
30442.0 |
| Average per block |
87.6 |
65.4 |
15.6 |
— |
| Min per block |
22 |
13.5 |
0 |
— |
| Max per block |
711.5 |
307.2 |
232.5 |
— |
| Point counts |
51.5 |
16.5 |
14.2 |
82.2 |
| Incidental observations |
309.7 |
448.9 |
553.8 |
1312.4 |
| Blockbusting |
1046.8 |
1619.4 |
73.9 |
2740.1 |
| Regular atlasing |
14264.2 |
10082.5 |
1960.7 |
26307.4 |
| Nighttime atlasing |
360.9 |
173.8 |
111.1 |
645.8 |
| Daytime atlasing |
15311.2 |
11993.8 |
2491.3 |
29796.3 |
Another way to evaluate effort is to use the number of species found on a block as a proxy. The additional hours spent on Priority 1 blocks appears to have translated to a greater number of species and confirmations, on average, compared to Priority 2 blocks (Table 2). The average number of species and confirmations on both Priority 1 and Priority 2 blocks exceeded the minimum required to consider a block to be completed.
Table 2. Average number of species and confirmations per block for PO, PR, and CO records (OB records not included).
| Average number | Priority 1 | Priority 2 | Priority 1&2 | Non-priority |
| Species |
86.6 |
82.7 |
84.6 |
16.6 |
| Confirmations |
43.1 |
41.8 |
42.5 |
8.1 |